![]()
This is how you use Process Monitor to record boot time data. Then you can review this information to determine where bottlenecks are happening.
Steps
Install ProcMon
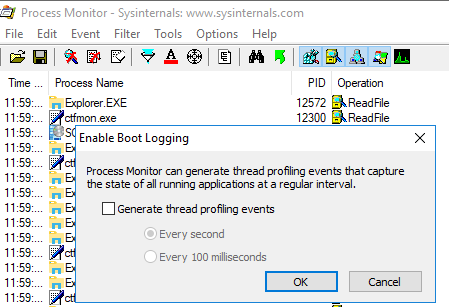
Enable Boot Logging
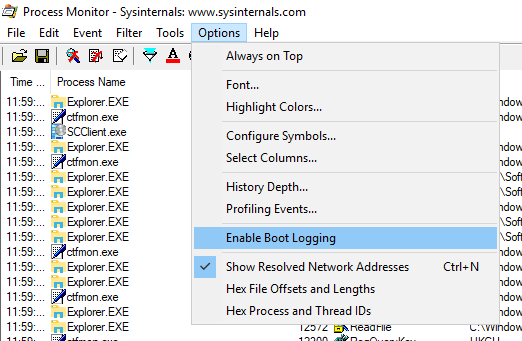
Select Generate threat profiling events
Reboot
Log in
Launch ProcMon
Select Yes to save collected data
Review data
Overview of Process Monitor Capabilities
Process Monitor includes powerful monitoring and filtering capabilities, including:
- More data captured for operation input and output parameters
- Non-destructive filters allow you to set filters without losing data
- Capture of thread stacks for each operation make it possible in many cases to identify the root cause of an operation
- Reliable capture of process details, including image path, command line, user and session ID
- Configurable and moveable columns for any event property
- Filters can be set for any data field, including fields not configured as columns
- Advanced logging architecture scales to tens of millions of captured events and gigabytes of log data
- Process tree tool shows relationship of all processes referenced in a trace
- Native log format preserves all data for loading in a different Process Monitor instance
- Process tooltip for easy viewing of process image information
- Detail tooltip allows convenient access to formatted data that doesn’t fit in the column
- Cancellable search
- Boot time logging of all operations
Video
Notes